TurfScore
Know your course at a glance.
Keeping a golf course in top shape has always relied on experience and a trained eye. But no one can watch hundreds of acres at once, and by the time a problem is visible, it's often already expensive to fix. Turf Score gives you a complete picture of your course's health, updated continuously.
One simple score tells the story.
Turf Score translates the condition of your course into simple, three-digit numbers. Each green, fairway, rough area, and tee box receives its own score, and those combine into an overall score for every hole and for the course as a whole. Higher numbers mean healthier turf. There are no charts to interpret and no sensor readings to decipher. Anyone on your team can look at the scores and understand them in seconds.
Catch problems early.
Turf Score picks up on the earliest signs of stress, such as dryness, disease, or wear, often before they're visible on the ground. Your crew can treat a small trouble spot today instead of repairing a large one next month. Water, fertilizer, and other applications go only where they're needed, which saves time, labor, and material costs.
Your course, wherever you are.
Scores update in real time and are available on any phone, tablet, or computer. Whether you're in the maintenance shop, at home, or traveling, you and your team see the same current picture of the course, so everyone works from the same information.
Better decisions over time.
Turf Score keeps a running history of your course's health. You can see which applications worked, show measurable results to your board or committee, and plan next season with real numbers behind you. The course stays in peak condition, and your team spends less time guessing.
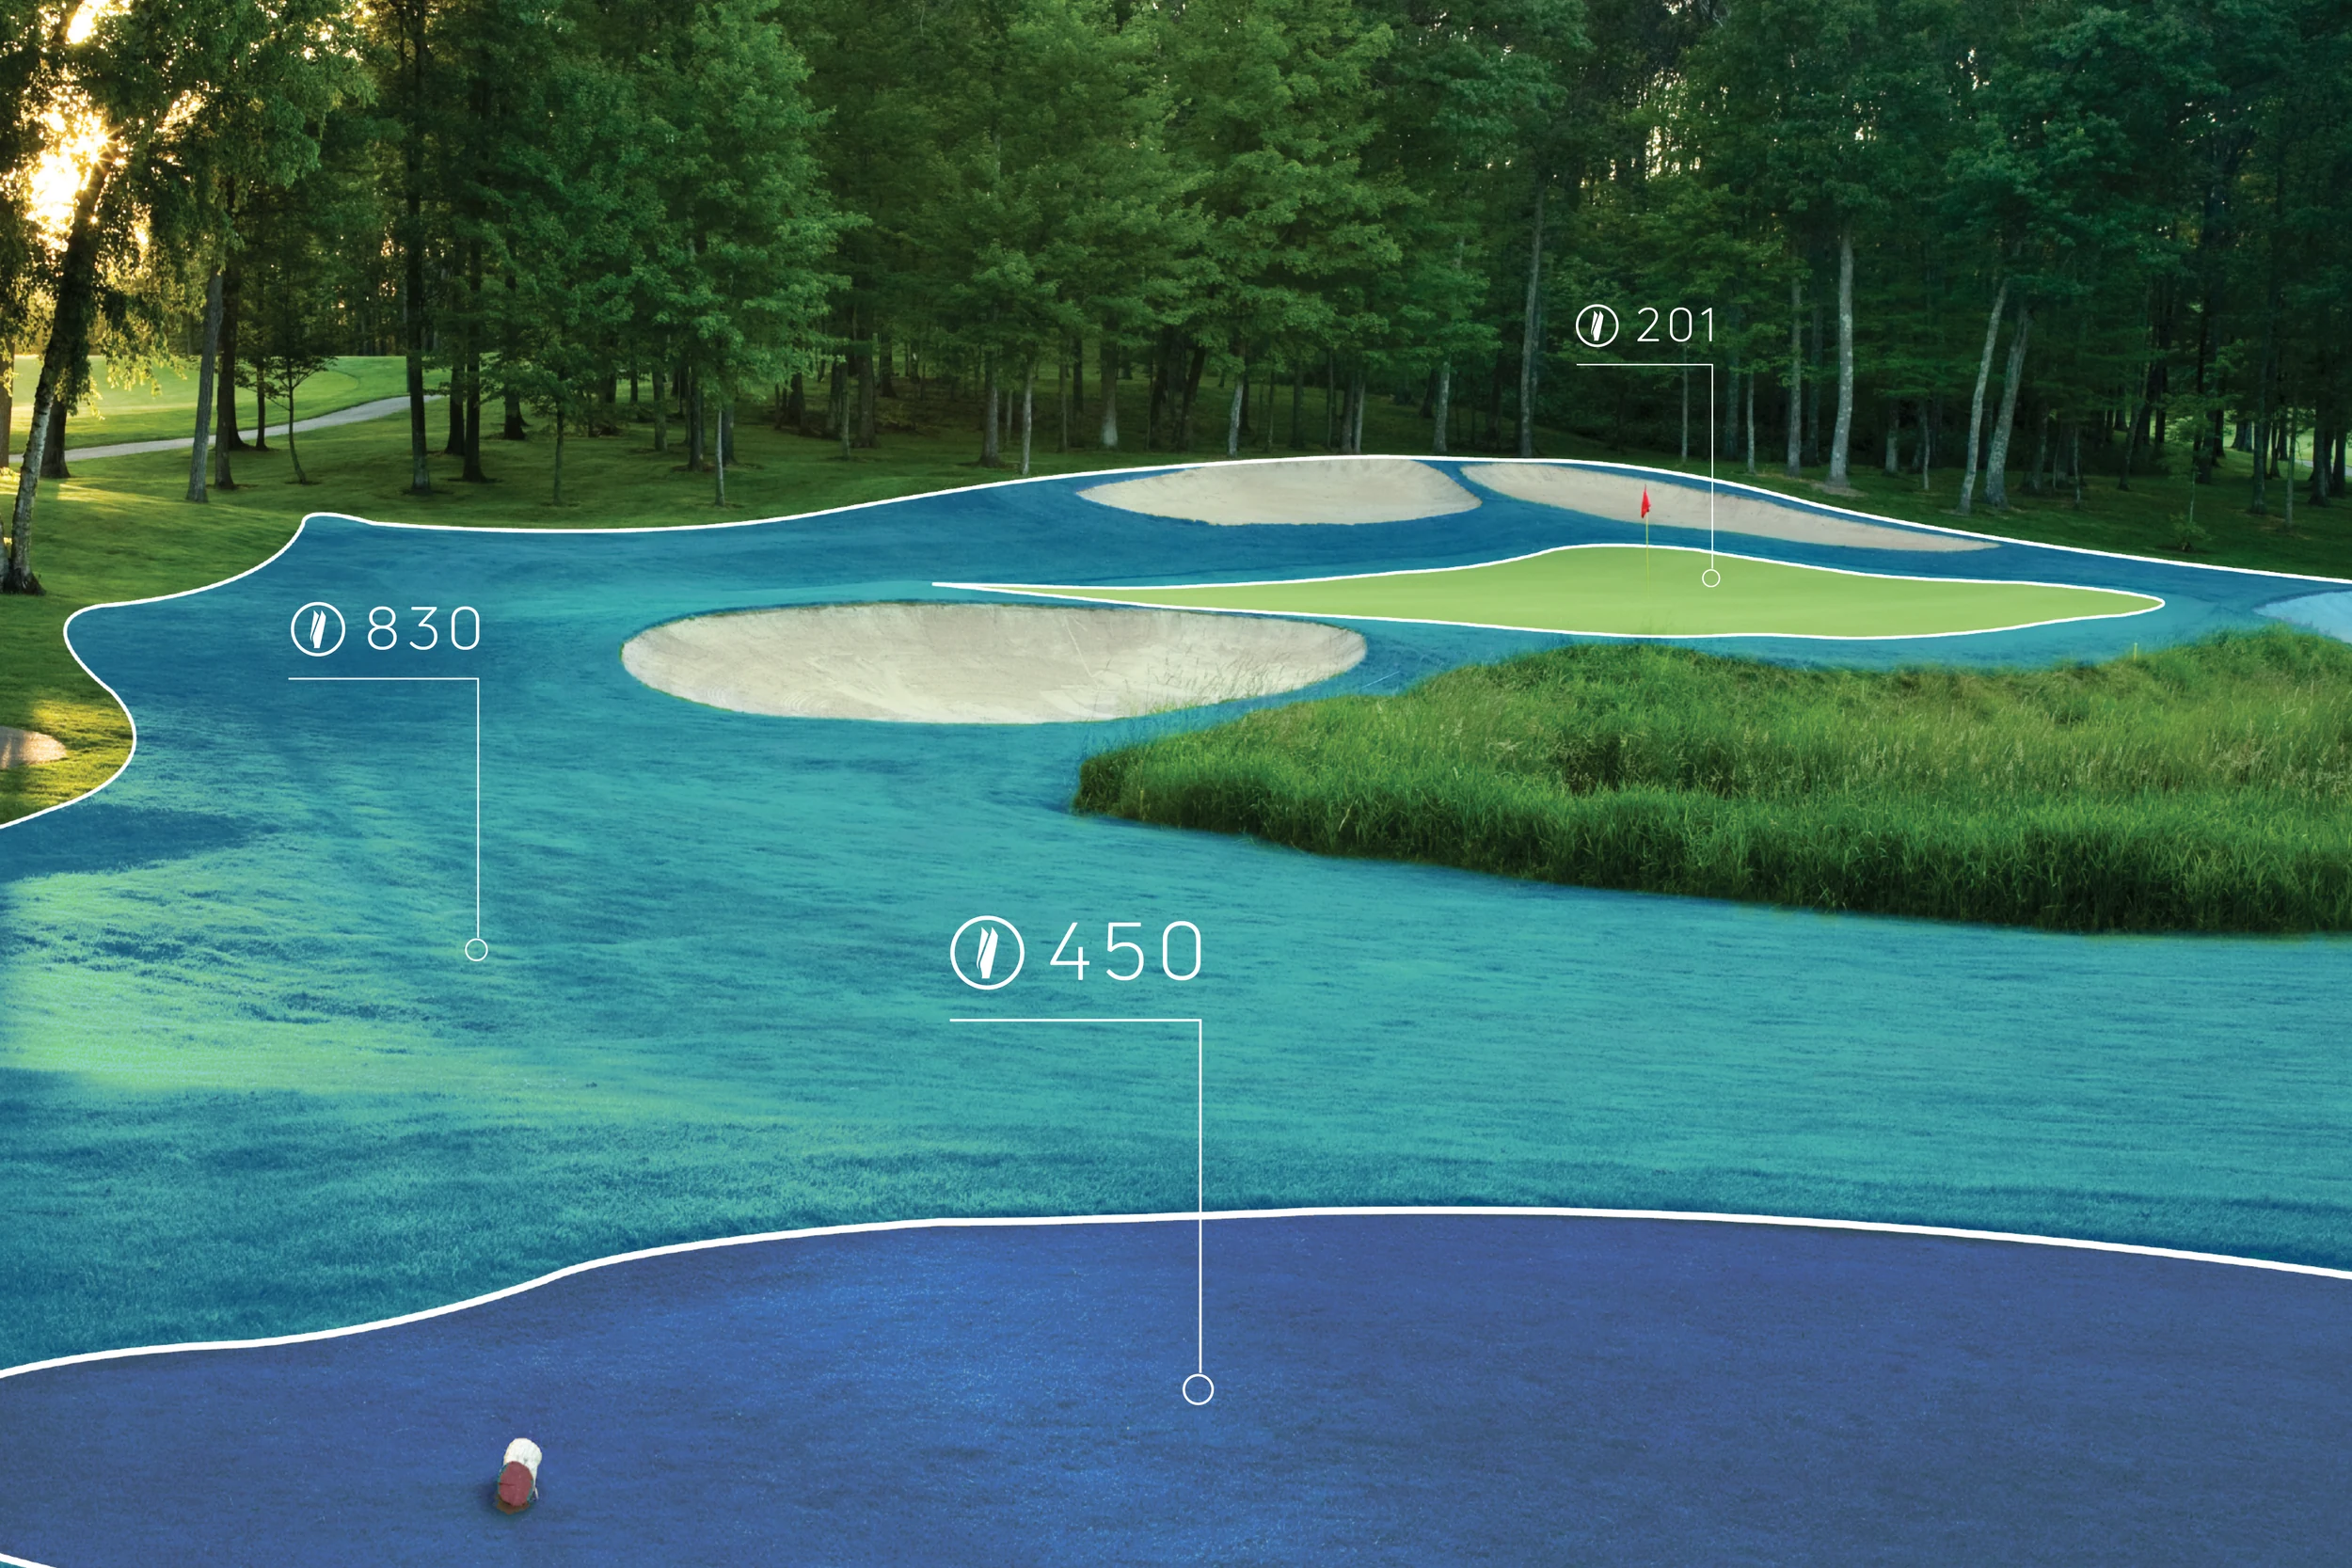
Feature Based Scoring gives every hole on your course a condition score, plus separate scores for the greens, fairways, rough, and tee boxes on that hole. You can see at a glance which surfaces are healthy and which need attention, without walking the property or interpreting imagery. If the fourth green starts slipping while everything around it holds steady, the score tells you before a golfer does.
Digital Twin
Every superintendent carries a mental map of their course, but a mental map cannot be measured, shared, or checked from home. The Digital Twin is a complete digital copy of your golf course, recreated in exact detail. Every fairway, green, bunker, and contour is there, and the model updates with every drone flight, so it always shows your course as it is right now.
Turf health, water movement, and wear patterns are layered directly into the model. Instead of jumping between reports, photos, and notes, you get one clear picture of the whole property. Zoom out to see the entire course or zoom in on a single trouble spot, all from your phone, tablet, or computer.
When it is time to work with an architect, engineer, or consultant, you can hand them the full course model instead of scheduling site visits or digging up old drawings. Everyone works from the same accurate, up-to-date view of the property, which saves time and prevents costly misunderstandings. New drainage, renovations, and construction projects can be measured and planned right inside the model, so you can scope the work, compare options, and make decisions with real numbers behind you before anyone breaks ground.
The result is less guesswork and more clarity. Your course, your data, and your plans all live in one accurate model that grows with your property and keeps members and management confident in every decision.
History Tracking
Every Turflogic flight is saved, so your course builds its own visual history over time. We call it the Turfstory. Using the History Slider, you can scroll back through that history the way you'd scroll through photos on your phone, and see exactly what any part of the course looked like last week, last month, or last season. That record shows you how your course responds to weather, play, and everything your crew does, so decisions are based on evidence rather than memory. It's the difference between managing what's in front of you today and managing the course over the long run.
Stress Maps
Every superintendent knows the frustration of spotting a problem area only after the damage is done. By the time turf stress is visible from the ground, you are already playing catch up. Stress Maps change that. After every drone flight, your entire course is analyzed and turned into a simple, color-coded picture of turf health that anyone on your team can read at a glance.
Think of it as a weather radar for your turf. The map lays a color overlay on top of a crisp aerial photo of your course. Where the turf is healthy, you simply see your course exactly as it looks from above, with no color at all. Where trouble is brewing, the map lights up.
The maps cover every part of the property: greens, fairways, tee boxes, and rough. That means your crew can go straight to the exact spots that need attention instead of relying on guesswork or waiting for members to point out brown patches.
Stress Maps also work as your proof of a job well done. After your team sprays or fertilizes, the next flight shows whether the application covered everything evenly. If a sprayer skipped a strip or a nozzle clogged, you will see it on the map before it shows up on the course. And as your treatments take effect, you can literally watch the colored areas fade away, giving you clear evidence that your plan is working and that your labor, water, and materials are being put to their best use.
The result is a course managed with confidence. You act on facts instead of hunches, catch problems while they are still invisible, and keep your playing surfaces at their best all year long.
Healthy (No Color)
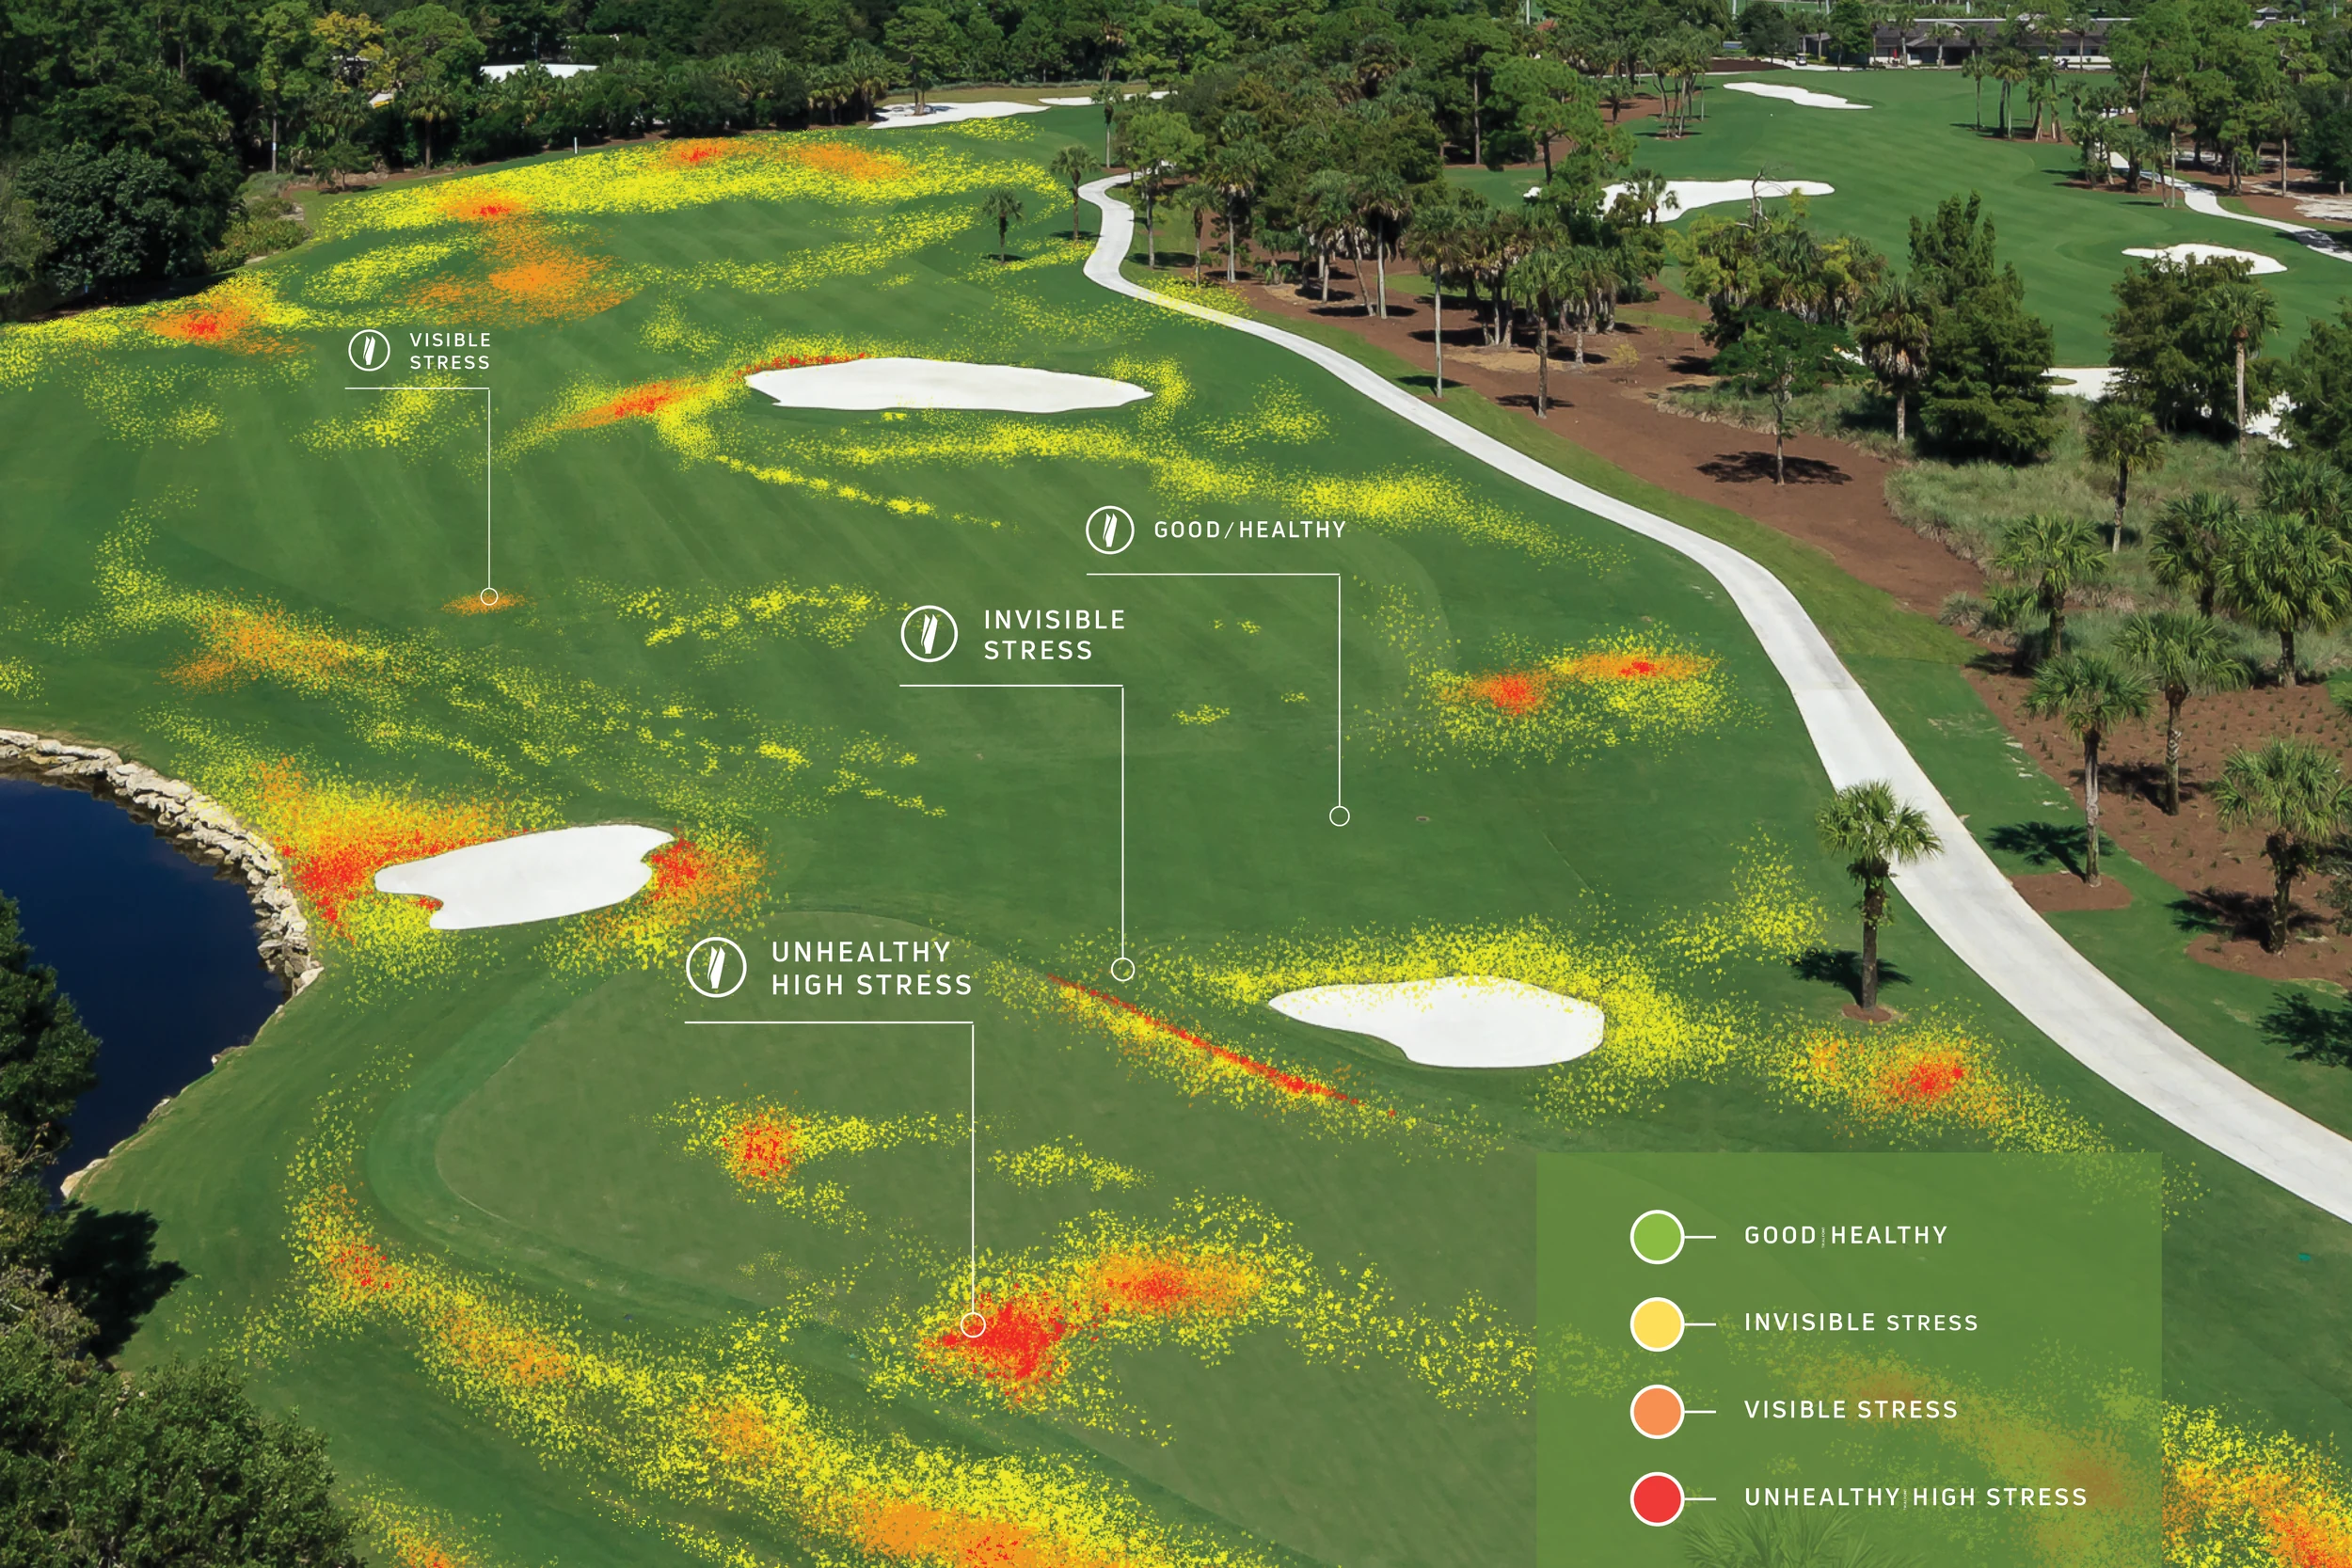
Where the turf is healthy, you simply see your course exactly as it looks from above, with no color at all.
Invisible (Yellow)
Yellow is your early warning. These are areas under stress that no one can see yet by walking the course. Catching problems at this stage is where Stress Maps deliver the most value, because a small adjustment now can prevent a costly repair later.
Visible (Orange)
Orange means the stress has likely become visible. These spots need dedicated attention to turn things around.
Unhealthy (Red)
Red marks turf that is already damaged or in decline. These are your top priorities.
Irrigation Mapping
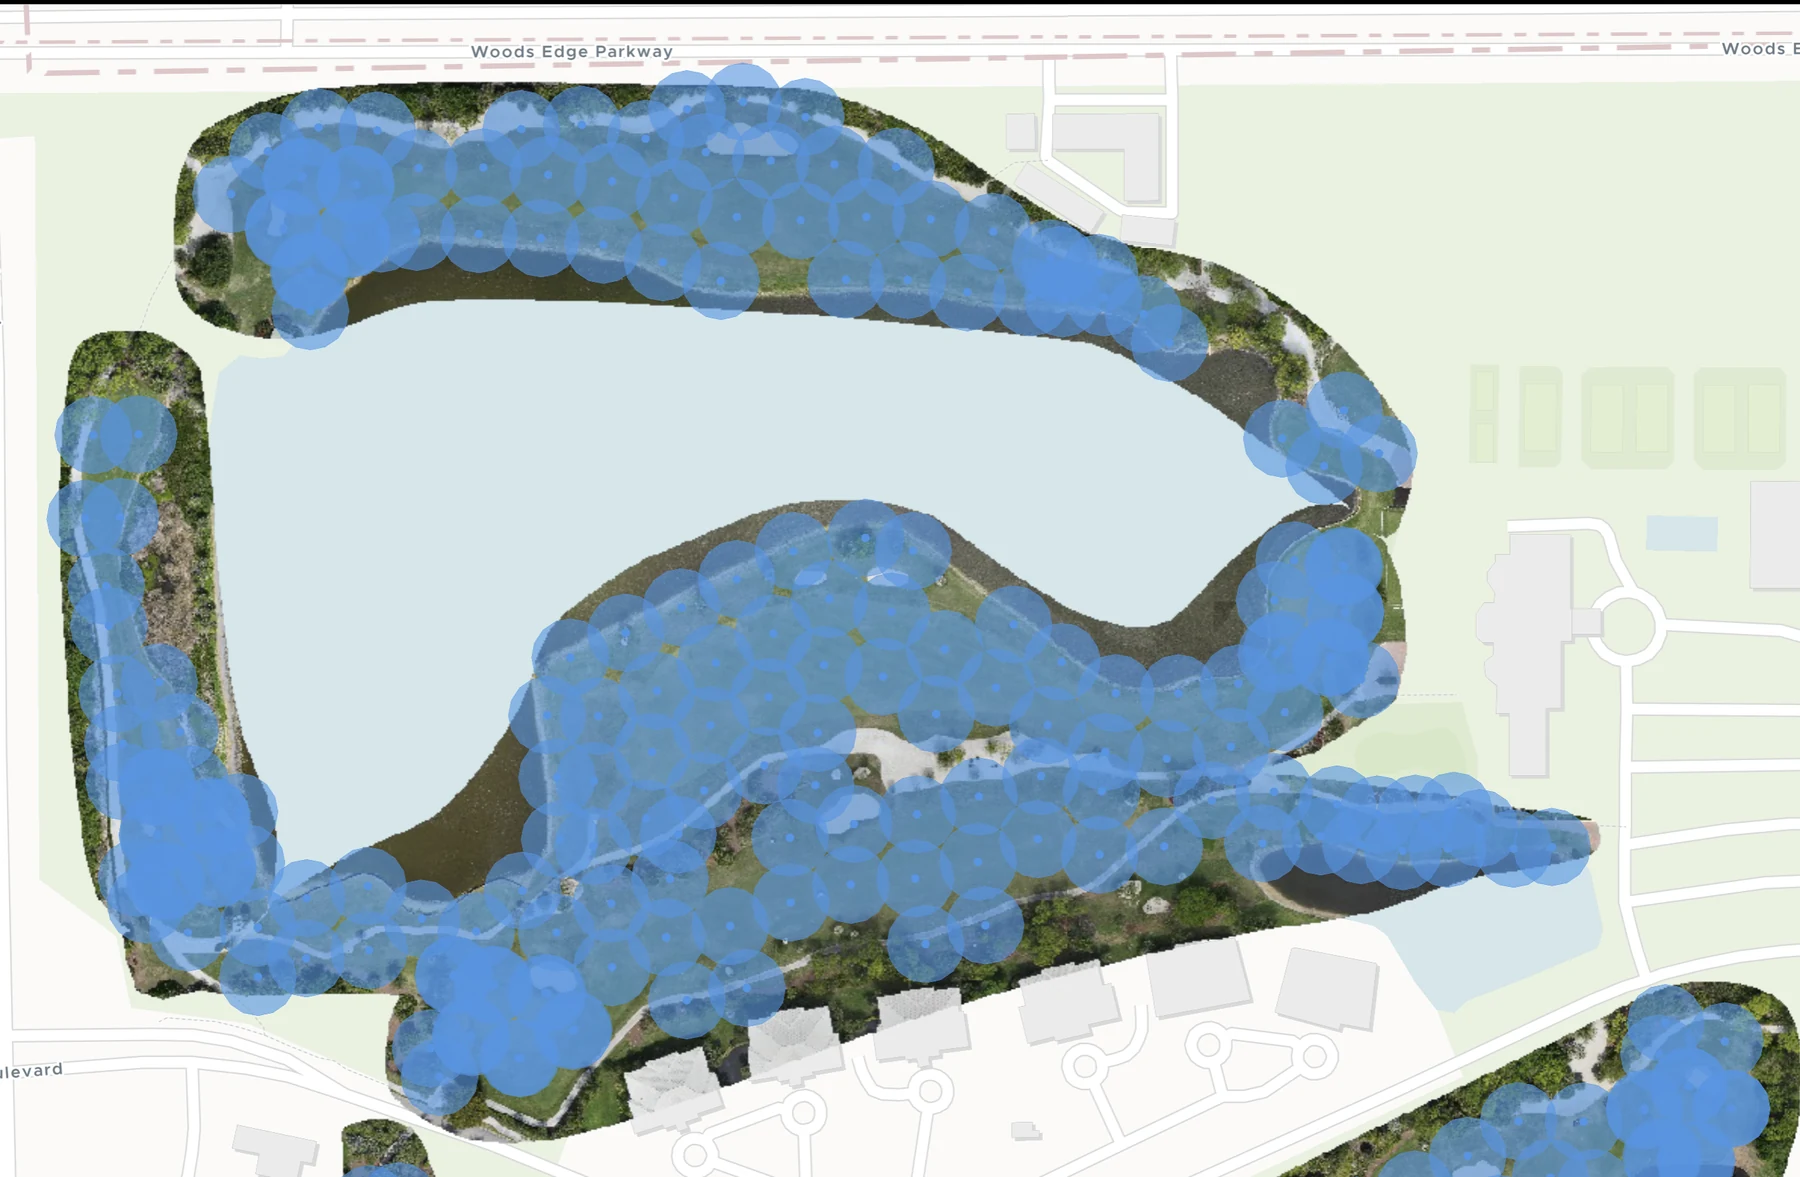
Every head, every zone, mapped as a living document. A complete GIS-accurate map of your irrigation system, overlaid with stress data so you know exactly where coverage meets consequence.
Mapped at a glance, coverage gaps exposed.
Every sprinkler head is geo-located on a live GIS map. Coverage radiuses show exactly where water reaches, and where it doesn't.
Remote Monitoring
The condition of a golf course used to live in one place: the head of the person managing it. Turflogic changes that by keeping everything it learns about your course in the cloud, where it can be reached from any computer or tablet. Your superintendent does not have to be in the office to check on the turf. If something looks off in the morning's data, they can take a tablet out on a cart and drive straight to the spot in question.
Just as useful is who else can see it. Courses often rely on outside help, whether that is an agronomist, a consultant, or the supplier who provides chemicals and equipment. With Turflogic, you can give those experts access to your course data directly. They see the same maps and history your team sees, so their recommendations are grounded in what is actually happening on your turf. For owners and management groups running more than one property, this becomes a way to keep an eye on all of them at once, compare how each is doing, and make sure a lesson learned at one course benefits the rest. Tablet access does require an internet connection to view course data, which is worth noting for crews working in areas with spotty coverage.

Construction Management
CAD files, Laser Scanning and Contour Maps
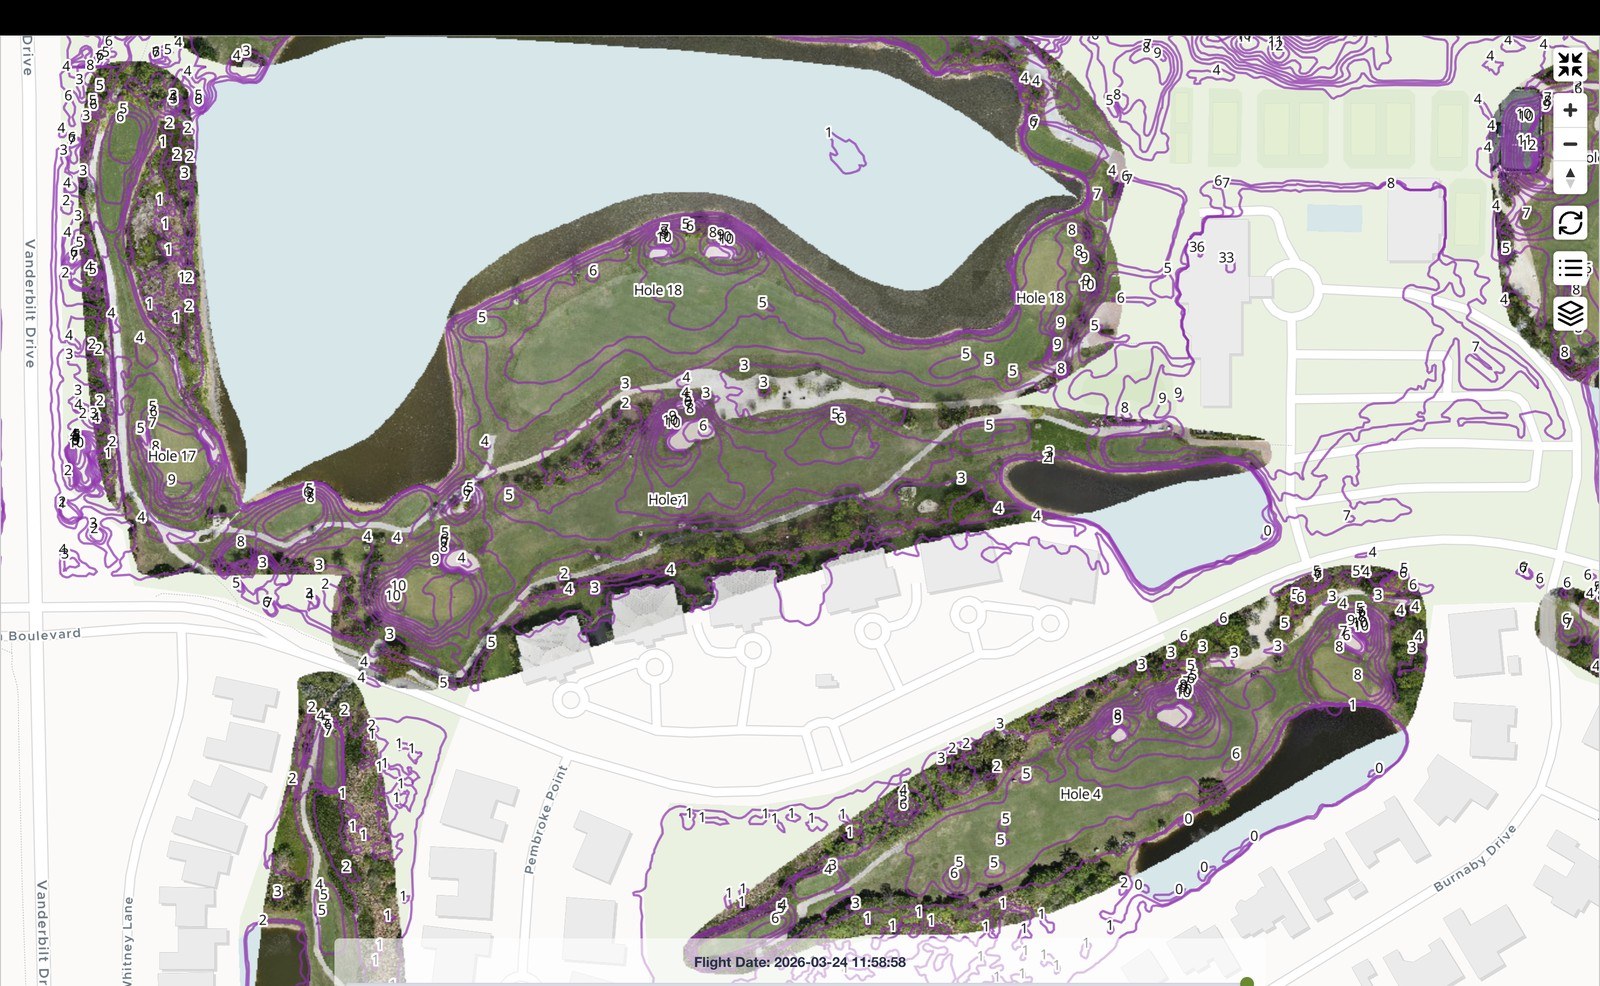
While Digitizing your course, our equipment takes hundreds of readings per square meter, creating contour lines and contour maps. Sprinkler system mapping, throws, and their radiuses are displayed, if available. LIDAR technology allows us to create detailed shape files, high resolution scanning and contour mapping. The files and mapping we create, can be provided to civil engineers and architects for any future construction projects. This will save you the expense and need for a surveyor!
Contour maps and contour lines provide an in-depth, accurate representation of your land’s natural features. This allows for precise measurements of elevation, gradients, and surface characteristics, which are essential for anyone involved in land development or project planning.
LiDAR scanning also produces a wealth of data, including detailed shape files that can be integrated directly into architectural and engineering software. For civil engineers, architects, and land planners, this means having access to highly accurate digital models that are ready for immediate use in design and development. The ability to generate these digital maps and models saves significant time and resources compared to traditional surveying methods, providing a faster, more efficient way to plan for construction or landscaping.
Traditional land surveys can be both expensive and time-consuming, requiring manual measurements and multiple site visits. By choosing to use Turflogic and our advanced mapping services, you eliminate the need for expensive surveyors while gaining access to more accurate, comprehensive data.
The drone sees the surface.
Metos sees the subsurface.
Subsurface data, layered onto the surface picture. Non-contact electromagnetic sensors read 20 inches deep: moisture, conductivity, salinity, compaction, mounted on your existing maintenance vehicle.