Turf Score gives you a simple, at-a-glance picture of your golf course's health.
Every part of your course receives its own easy-to-read, three-digit score, including each green, fairway, rough, and tee box. Those scores roll up into one overall score for the entire property. No spreadsheets and no jargon. Just clear numbers that tell you exactly where your course is thriving and where it needs attention.
Everything updates in real time and is available on any device, so you always know how your course is doing, whether you're standing on the 9th green or checking in from home. Spot small issues before they become big ones, focus your team's time and resources where they matter most, and keep your course looking its best all year long.
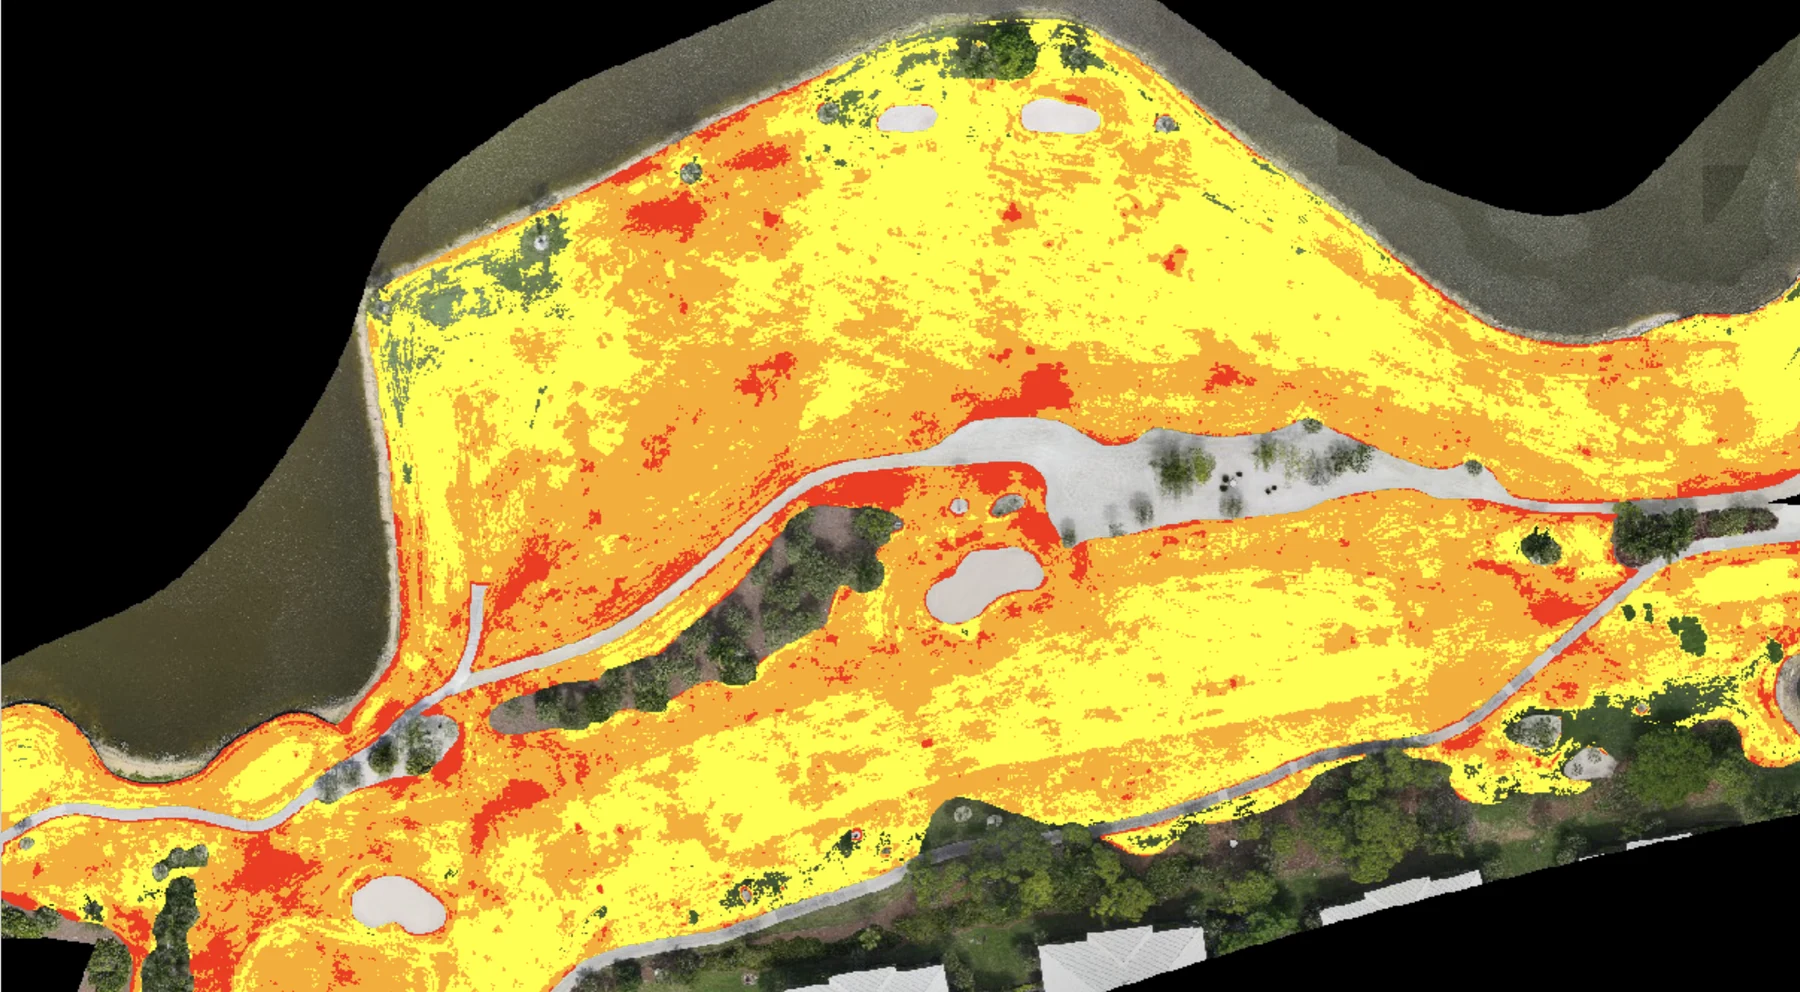
See how the scoring works →Stress Maps turn every drone flight into a simple, color-coded picture of your turf's health. Healthy areas show as a clear aerial photo of your course. Trouble spots light up in yellow, orange, or red depending on how serious they are, with yellow revealing stress before it can even be seen from the ground.
That early warning lets your team fix small problems before they become big ones. The maps also confirm that sprays and fertilizer went down completely and evenly, and let you watch problem areas fade as your treatments take effect. It is proof, in living color, that your plan is working.
See how stress maps work →
Integrated intelligence, not scattered tools. One picture of your course's condition, from surface to subsurface.
Turf Score gives you a simple, at-a-glance picture of your golf course's health.
Every part of your course receives its own easy-to-read, three-digit score, including each green, fairway, rough, and tee box. Those scores roll up into one overall score for the entire property. No spreadsheets and no jargon. Just clear numbers that tell you exactly where your course is thriving and where it needs attention.
Everything updates in real time and is available on any device, so you always know how your course is doing, whether you're standing on the 9th green or checking in from home. Spot small issues before they become big ones, focus your team's time and resources where they matter most, and keep your course looking its best all year long.
Stress Maps turn every drone flight into a simple, color-coded picture of your turf's health. Healthy areas show as a clear aerial photo of your course. Trouble spots light up in yellow, orange, or red depending on how serious they are, with yellow revealing stress before it can even be seen from the ground.
That early warning lets your team fix small problems before they become big ones. The maps also confirm that sprays and fertilizer went down completely and evenly, and let you watch problem areas fade as your treatments take effect. It is proof, in living color, that your plan is working.
Every Turflogic flight is saved, so your course builds its own visual history over time. We call it the Turfstory. Using the History Slider, you can scroll back through that history the way you'd scroll through photos on your phone, and see exactly what any part of the course looked like last week, last month, or last season. That record shows you how your course responds to weather, play, and everything your crew does, so decisions are based on evidence rather than memory. It's the difference between managing what's in front of you today and managing the course over the long run.
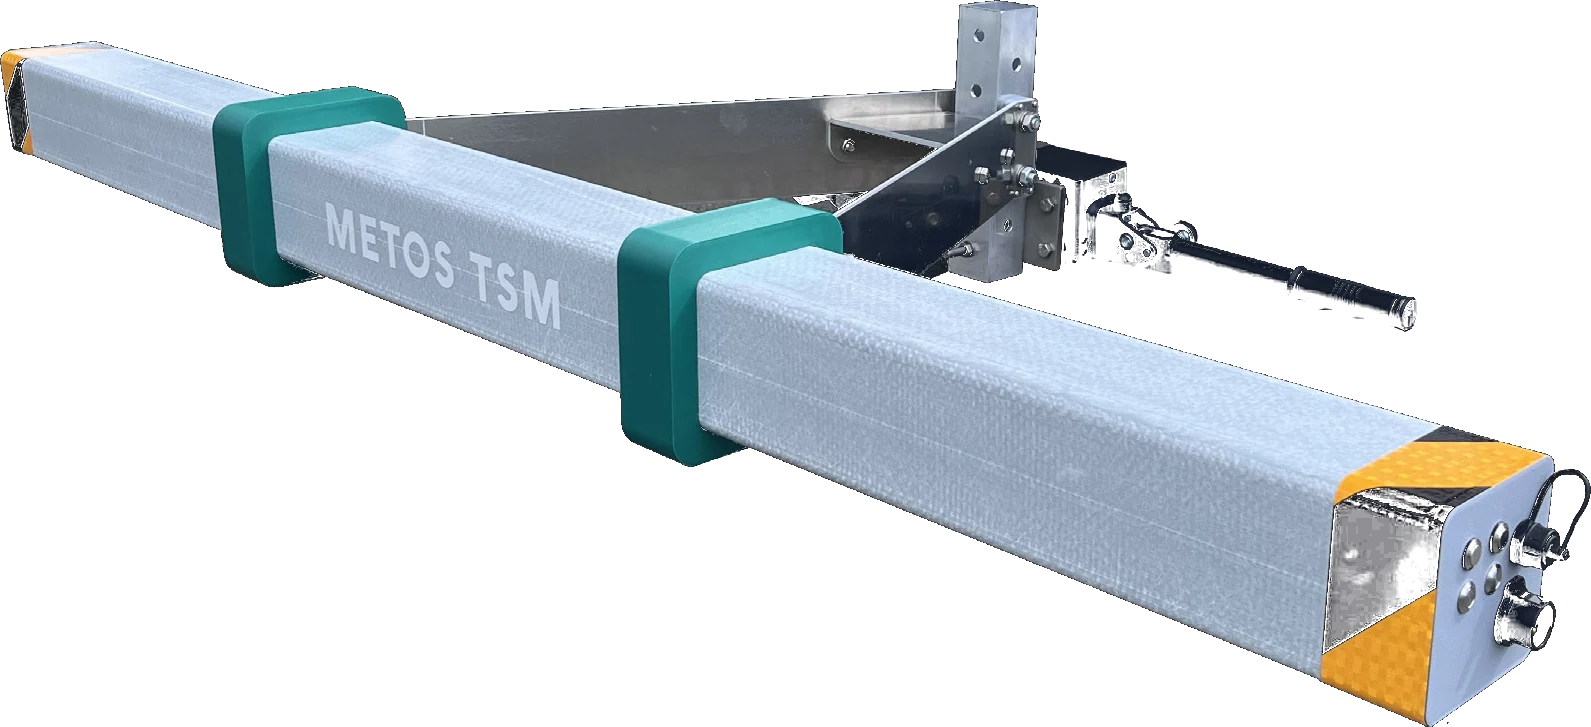
A non-contact soil scanner mounted to your maintenance vehicle reads 20 inches deep as you drive normal routes. Moisture, conductivity, salinity, and compaction are layered against your surface stress intelligence to reveal why, not just where.
Turflogic already flies over championship turf across the network, from resort courses to private clubs.


Credibility through association, the people who maintain these courses in their own words.


Tell us your course. We'll show you exactly what Turflogic looks like on your fairways, greens, and tee boxes.
"The TurfScore gives my committee one number they trust. It's ended the argument about where the budget goes and put it back on the data."